Benchmarks
We here provide comparisons to LSTM models on the CAMELS data (top of page) as well as comparisons to the current National Water Model at the national scale (bottom of this page), and more comparisons will be provided here.
We recently updated our LSTM, and you can find the high-flow expert on hydroDL repo's tutorial (see Codes tab on this website). The first and forecast benchmark is over the CAMELS dataset. The results can vary slightly due to training/test periods. Below you will find results for 10-year training (exactly as reported in Kratzert et al., 2019) and 15-year training (shown in this Figure). Besides NSE and KGE, we also report absolute FHV and FLV (these metrics have + or - signs, and they make more sense after taking the absolute sign) and low-flow and high-flow RMSE. So far, the best LSTM is LSTM-hydroDL (high-flow expert) and the best differentiable model is \(\delta\)HBV.adjoint (https://hess.copernicus.org/preprints/hess-2023-258/). As time goes on, we will also report benchmarks on the global dataset and other papers. We also know that spatial test (trained on some basins, tested on some other basins) or prediction in ungauged regions (PUR) tests (tested in a large region without training data) are more stringent tests and will likely change the comparisons. We previously found differentiable model to perform better in the PUR test (Feng et al., 2023 https://doi.org/10.5194/hess-27-2357-2023).
CDF Comparison
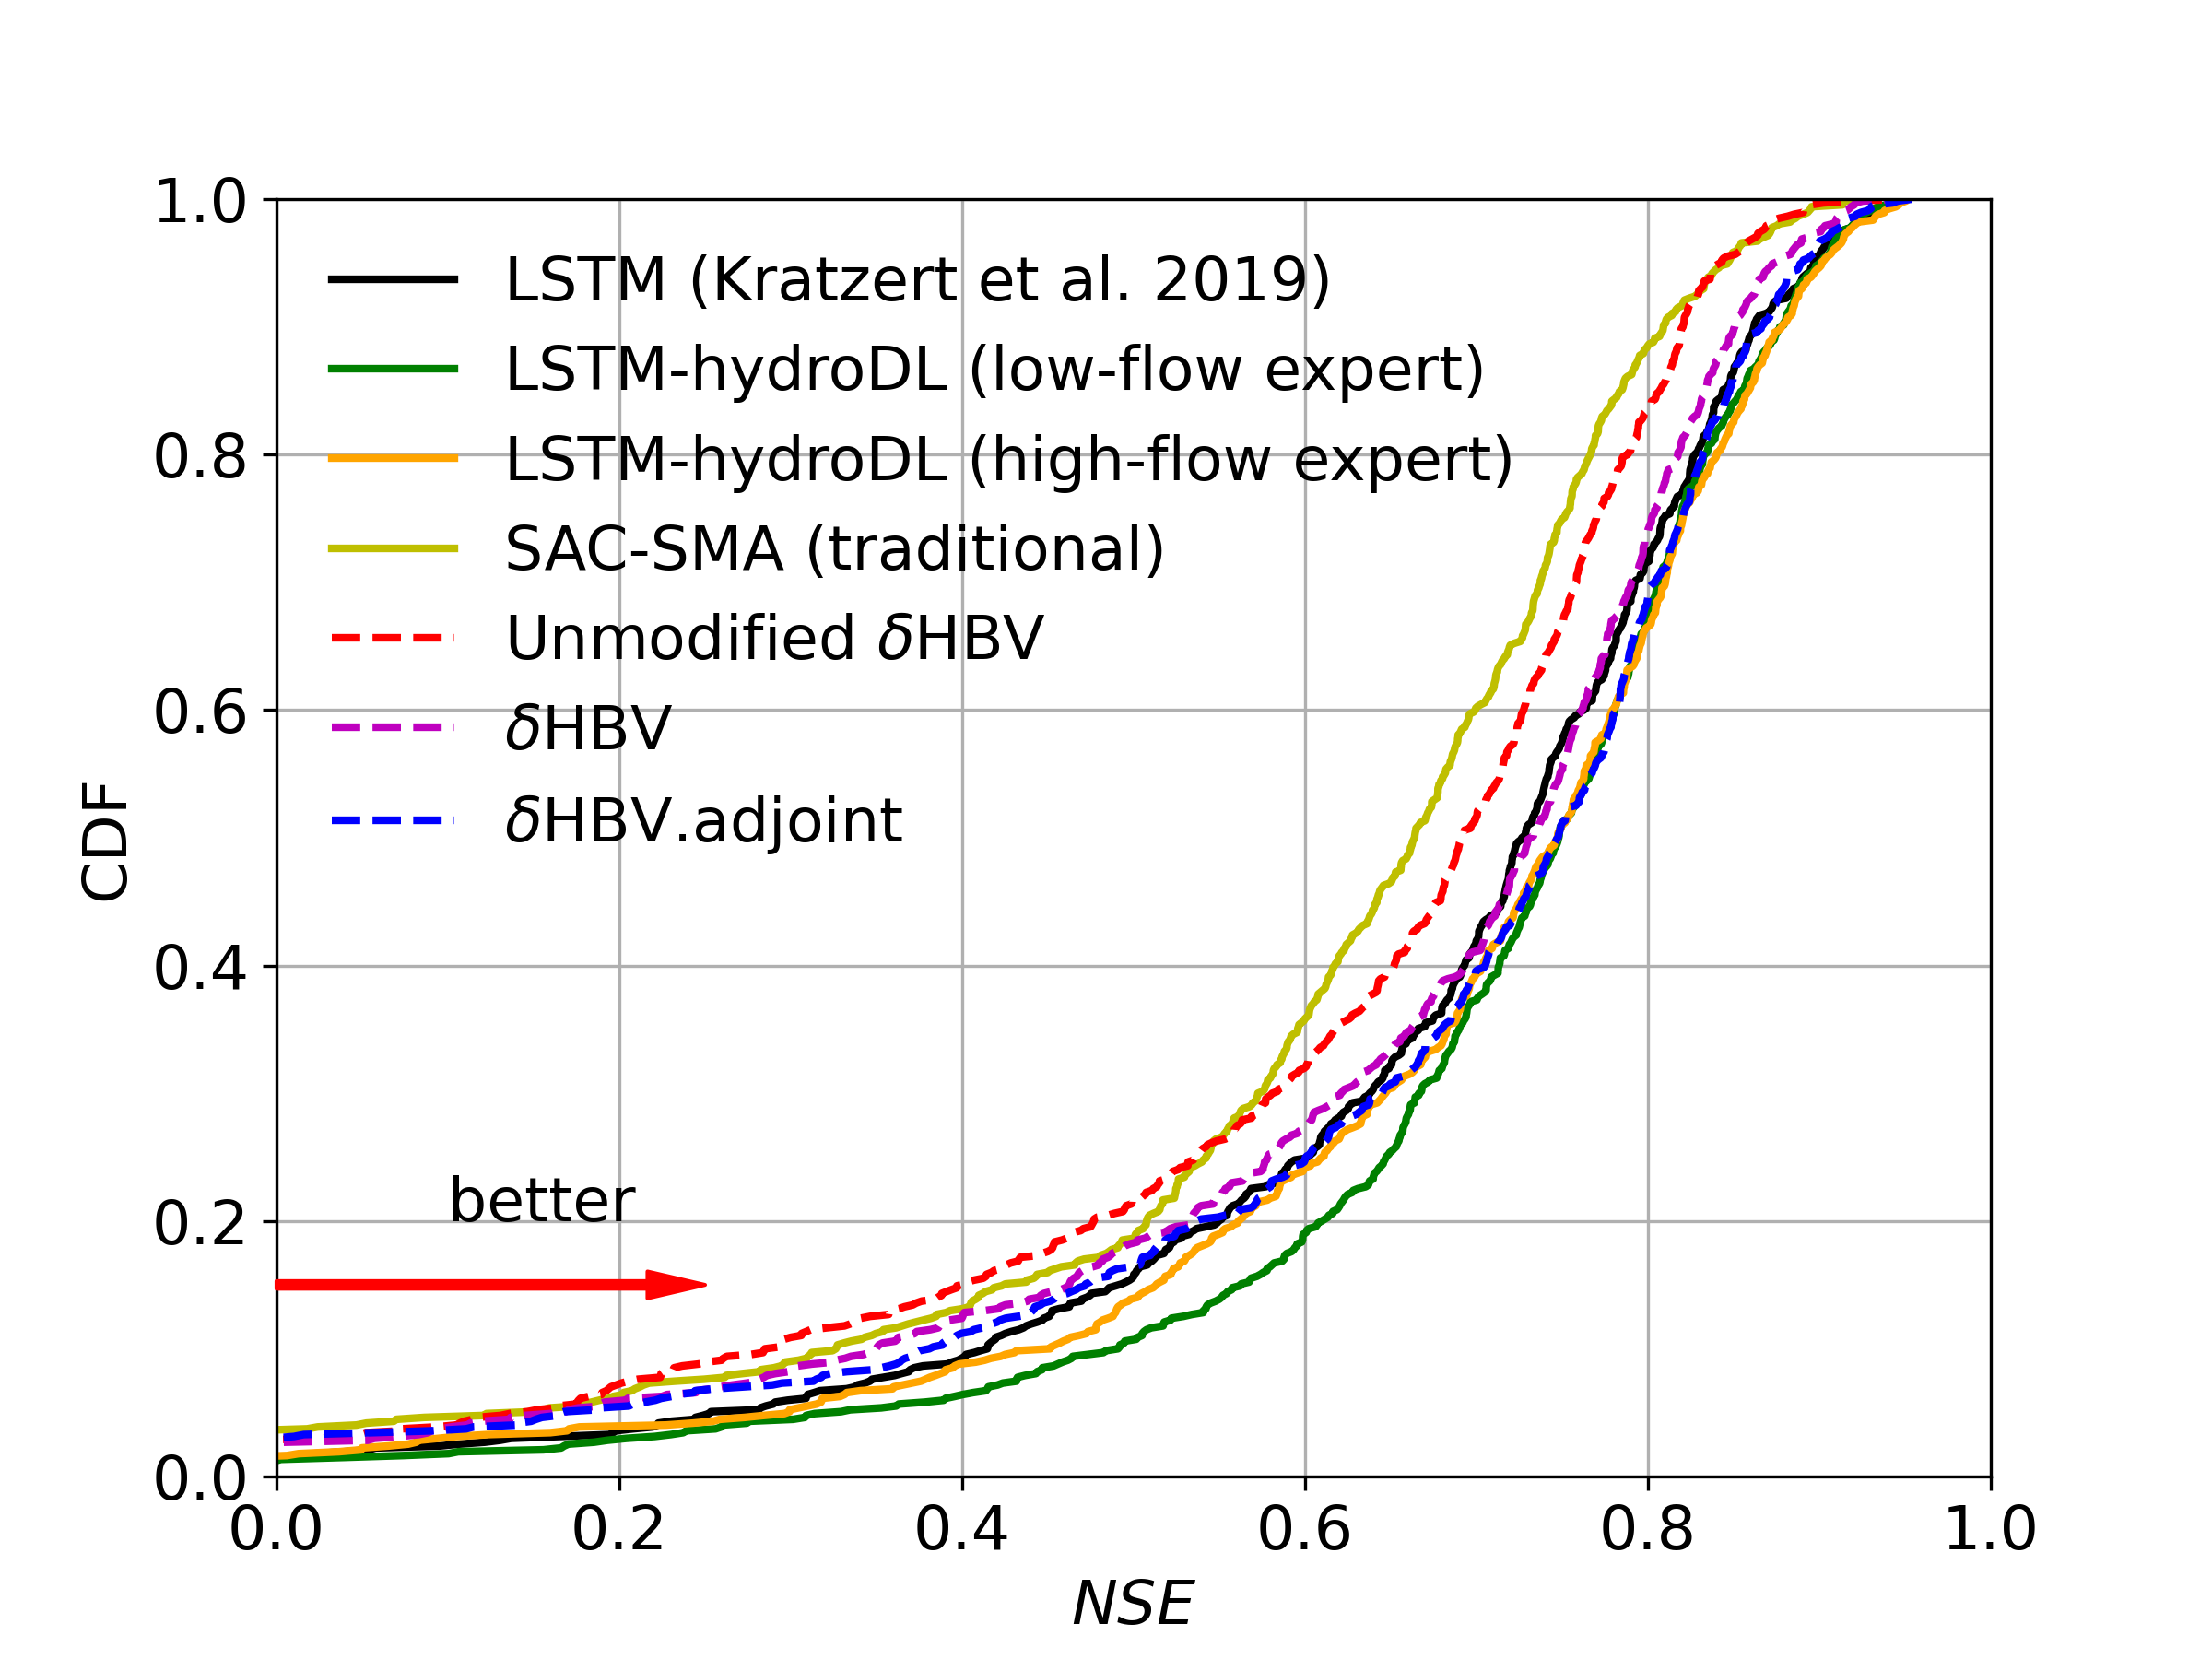
Camels NSE of popular streamflow models (single, without ensemble) wth 15-year training. This is a temporal test (trained on ). We compared 3 versions of differentiable HBV model ("Unmodified"-- without any structural update; \(\delta\)HBV -- a sequential differentiable HBV published in Feng et al., 2022; and \(\delta\)HBV.adjoint, slightly modified from Song et al., 2023. See refs below) with two versions of hydroDL implementation (a high-flow expert and a low-flow expert). We also trained the LSTM from Kratzert 2019 for comparison.
Metric Tables
10-year training comparison
Info
All models were trained from 1999/10/01 to 2008/09/30 and tested from 1989/10/01 to 1999/09/30 on the subset of 531 CAMELS basins.
| Model | Median NSE | Median KGE | Median Absolute (Non-Absolute) FLV (%) | Median Absolute (Non-Absolute) FHV (%) | Median low flow RMSE (mm/day) | Median peak flow RMSE (mm/day) |
|---|---|---|---|---|---|---|
| LSTM-hydroDL-single (high-flow expert) | 0.74 | 0.76 | 31.79 (-9.08) | 16.20 (-13.42) | 0.049 | 3.28 |
| LSTM-hydroDL-Ensemble (high-flow expert) | 0.765 | 0.77 | 28.84 (-3.88) | 16.21 (-13.38) | 0.046 | 3.27 |
| LSTM-single ran w/ code in Kratzert et al. (2019) | 0.74 | 0.75 | 32.02 (5.54) | 18.02 (-15.80) | 0.051 | 3.70 |
| LSTM-single (Kratzert et al. 2019) As reported | 0.731 | - | - (26.5) | - (-14.8) | - | - |
| LSTM-Ensemble (Kratzert et al. 2019) As reported | 0.758 | - | - (55.1) | - (-15.7) | - | - |
15-year training comparison
Info
All models were trained from 1980/10/01 to 1995/09/30 and tested from 1995/10/01 to 2010/09/30 on all 671 CAMELS basins.
| Model | Median NSE | Median KGE | Median Absolute (Non-Absolute) FLV (%) | Median Absolute (Non-Absolute) FHV (%) | Median low flow RMSE (mm/day) | Median peak flow RMSE (mm/day) | Baseflow index spatial correlation | Median NSE of temporal ET simulation |
|---|---|---|---|---|---|---|---|---|
| LSTM-hydroDL (low-flow expert) | 0.73 | 0.76 | 19.52 (12.21) | 15.01 (-4.12) | 0.023 | 2.67 | - | - |
| LSTM-hydroDL (high-flow expert) | 0.74 | 0.78 | 37.33 (-20.72) | 13.68 (-4.30) | 0.048 | 2.49 | - | - |
| LSTM ran w/ code in Kratzert et al. (2019) | 0.73 | 0.77 | 40.59 (29.70) | 13.46 (-4.19) | 0.055 | 2.56 | - | - |
| SAC-SMA (Traditional) | 0.66 | 0.73 | 59.40 (46.96) | 17.55 (-9.79) | 0.081 | 3.19 | - | - |
| Unmodified \(\delta\)HBV | 0.69 | 0.72 | 47.58 (16.84) | 16.40 (-10.80) | 0.066 | 2.74 | 0.76 | 0.43 |
| \(\delta\)HBV | 0.73 | 0.73 | 56.53 (50.93) | 15.29 (-8.89) | 0.074 | 2.56 | 0.76 | 0.59 |
| \(\delta\)HBV.adj (expert 1) | 0.72 | 0.75 | 43.29 (37.61) | 13.25 (-4.33) | 0.048 | 2.47 | 0.83 | 0.61 |
| \(\delta\)HBV.adj (expert 2) | 0.75 | 0.76 | 40.56 (32.78) | 14.09 (-7.97) | 0.045 | 2.59 | 0.87 | 0.62 |
Citations
Kratzert, Frederik, Daniel Klotz, Guy Shalev, Günter Klambauer, Sepp Hochreiter, and Grey
Nearing. "Benchmarking a catchment-aware long short-term memory network (LSTM) for
large-scale hydrological modeling." Hydrol. Earth Syst. Sci. Discuss 2019 (2019): 1-32.
Newman, Andrew J., Martyn P. Clark, Kevin Sampson, Andrew Wood, Lauren E. Hay, Andy Bock,
Roland J. Viger et al. "Development of a large-sample watershed-scale hydrometeorological
data set for the contiguous USA: data set characteristics and assessment of regional
variability in hydrologic model performance." Hydrology and Earth System Sciences 19, no. 1
(2015): 209-223.
Comparison with National Water Models
Funded by CIROH projects, we have produced initial comparisons at the continental scale showing the superior performance of the differentiable models compared to both NOAA’s first-generation WRF-Hydro.NWM Model, version 1.2 (Tijerina‐Kreuzer et al., 2021) and version 2.1 (Cosgrove et al., 2024). The differentiable routing model developed in our FY22 CIROH project is used for runoff routing using Muskingum-Cunge method. We are now producing seamless streamflow simulations at high spatial resolution for the whole CONUS and the results below are demonstrating one of the simulations. We are still improving the runoff, forcing, and routing aspects of the product. Several updates are incoming. Please stand by for a data release!
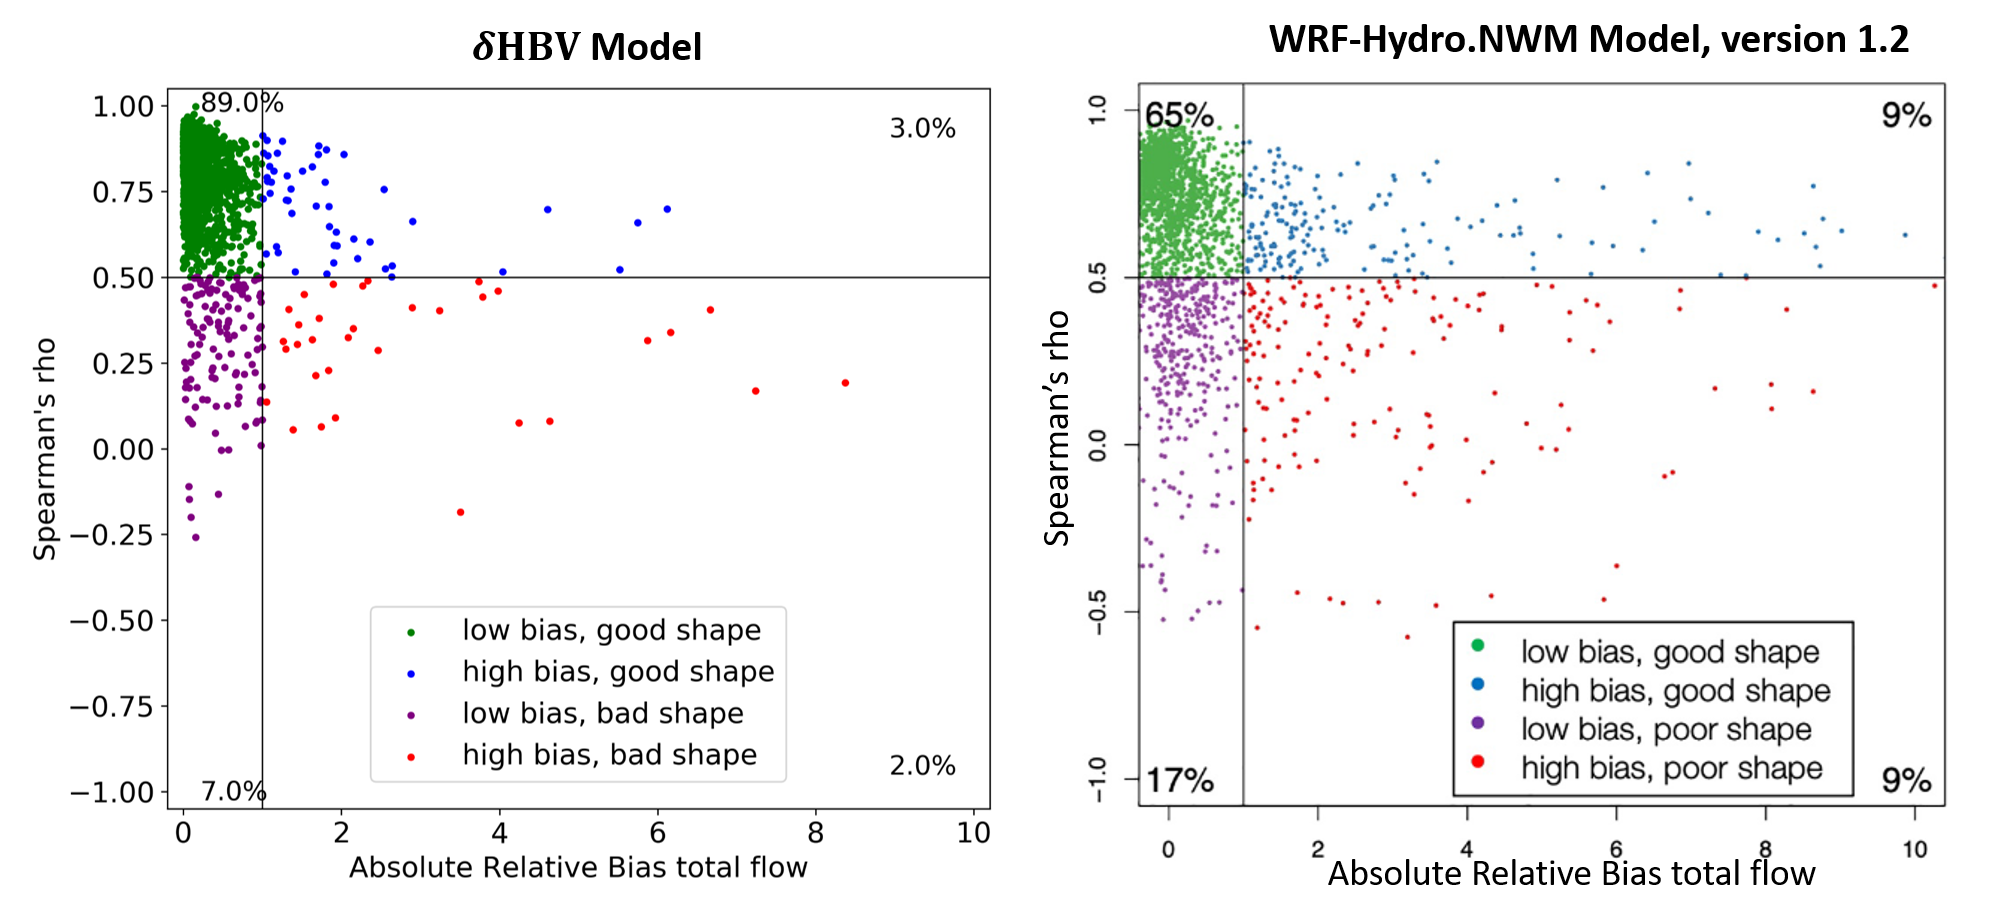
Condon diagrams comparing streamflow performance for \(\delta\)HBV -- differentiable HBV and National Water Model, version 1.2. The \(\delta\)HBV is trained from 10/1980 to 09/1995 and tested from 01/1981 to 12/2019. NWM Model, version 1.2 is uncalibrated and tested from 10/1984 to 09/1985 (reprinted from Tijerina‐Kreuzer et al., 2021)
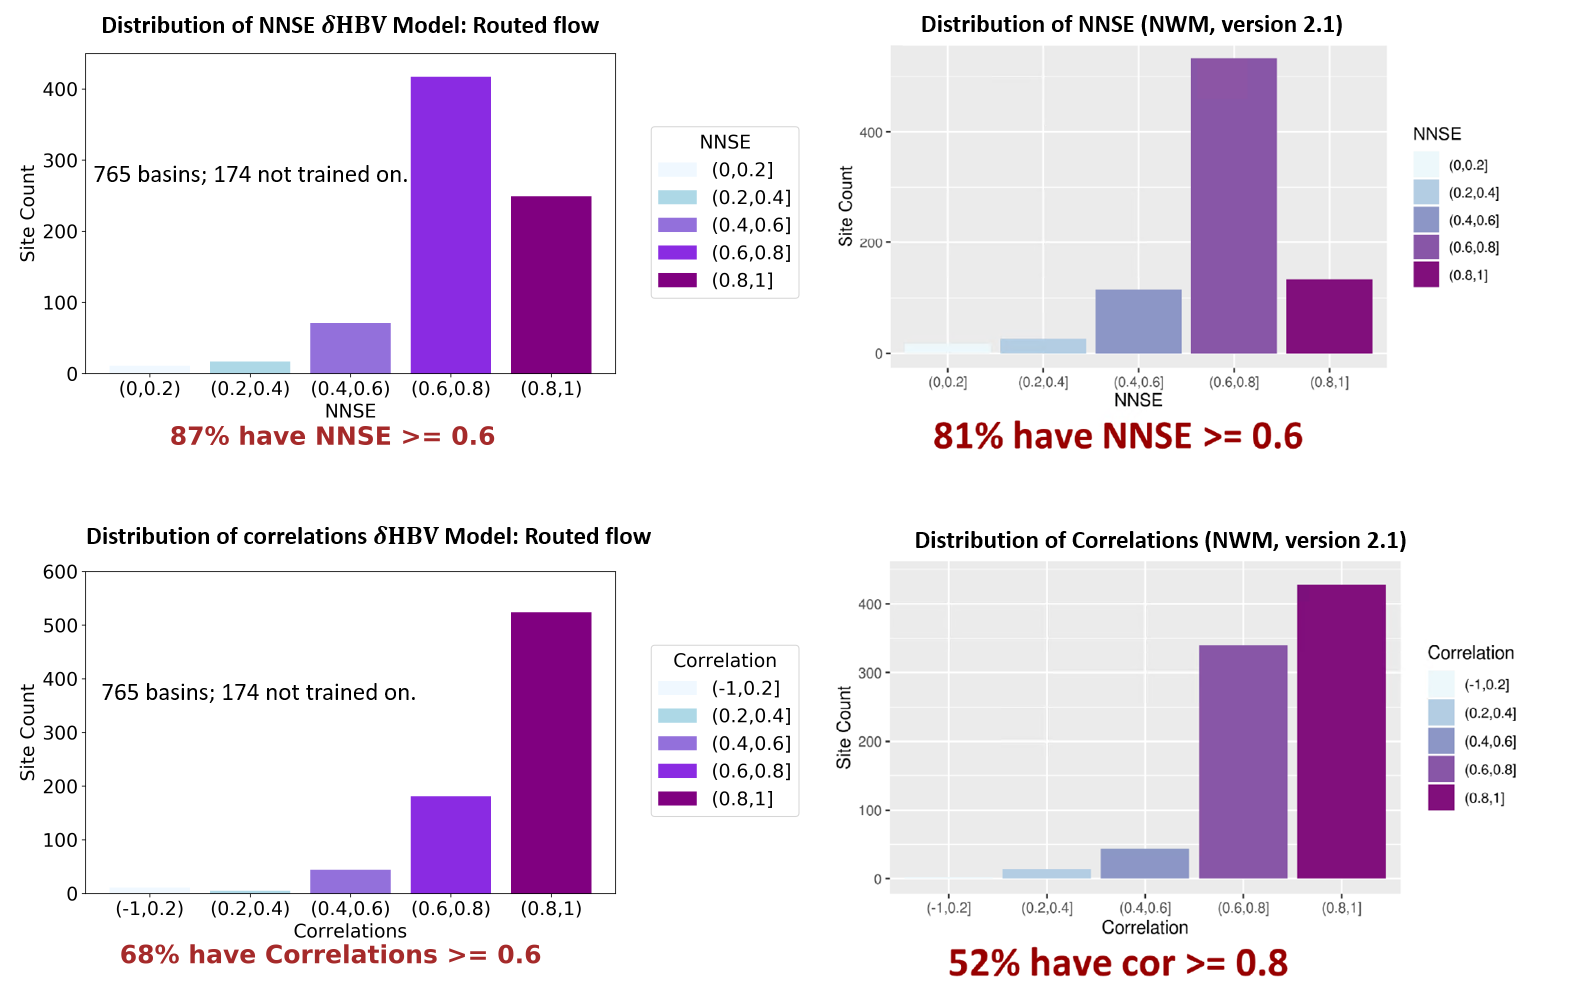
Streamflow normalized Nash Sutcliffe Efficiency (NNSE) and correlation comparison between \(\delta\)HBV -- differentiable HBV and NWM Model, version 2.1. The \(\delta\)HBV is trained from 10/1980 to 09/1995 and tested from 01/1981 to 12/2019. NWM Model, version 2.1 is calibrated from 10/2008 to 09/2013 and tested from 10/2013 to 09/2016 (reprinted from Cosgrove et al., 2024).
Ensemble performances
Recent CAMELS benchmarks also show that δHBV provides important process-based constraints when ensembled with LSTM, improving streamflow simulation especially in spatial tests such as PUB (prediction in ungauged basins) and PUR (prediction in ungauged regions). In Li et al. (2025), adding δHBV to LSTM ensembles helped reduce performance losses in ungauged settings, while the best-performing ensembles further combined this model diversity with multiple meteorological forcing datasets, including Daymet, NLDAS, and Maurer.
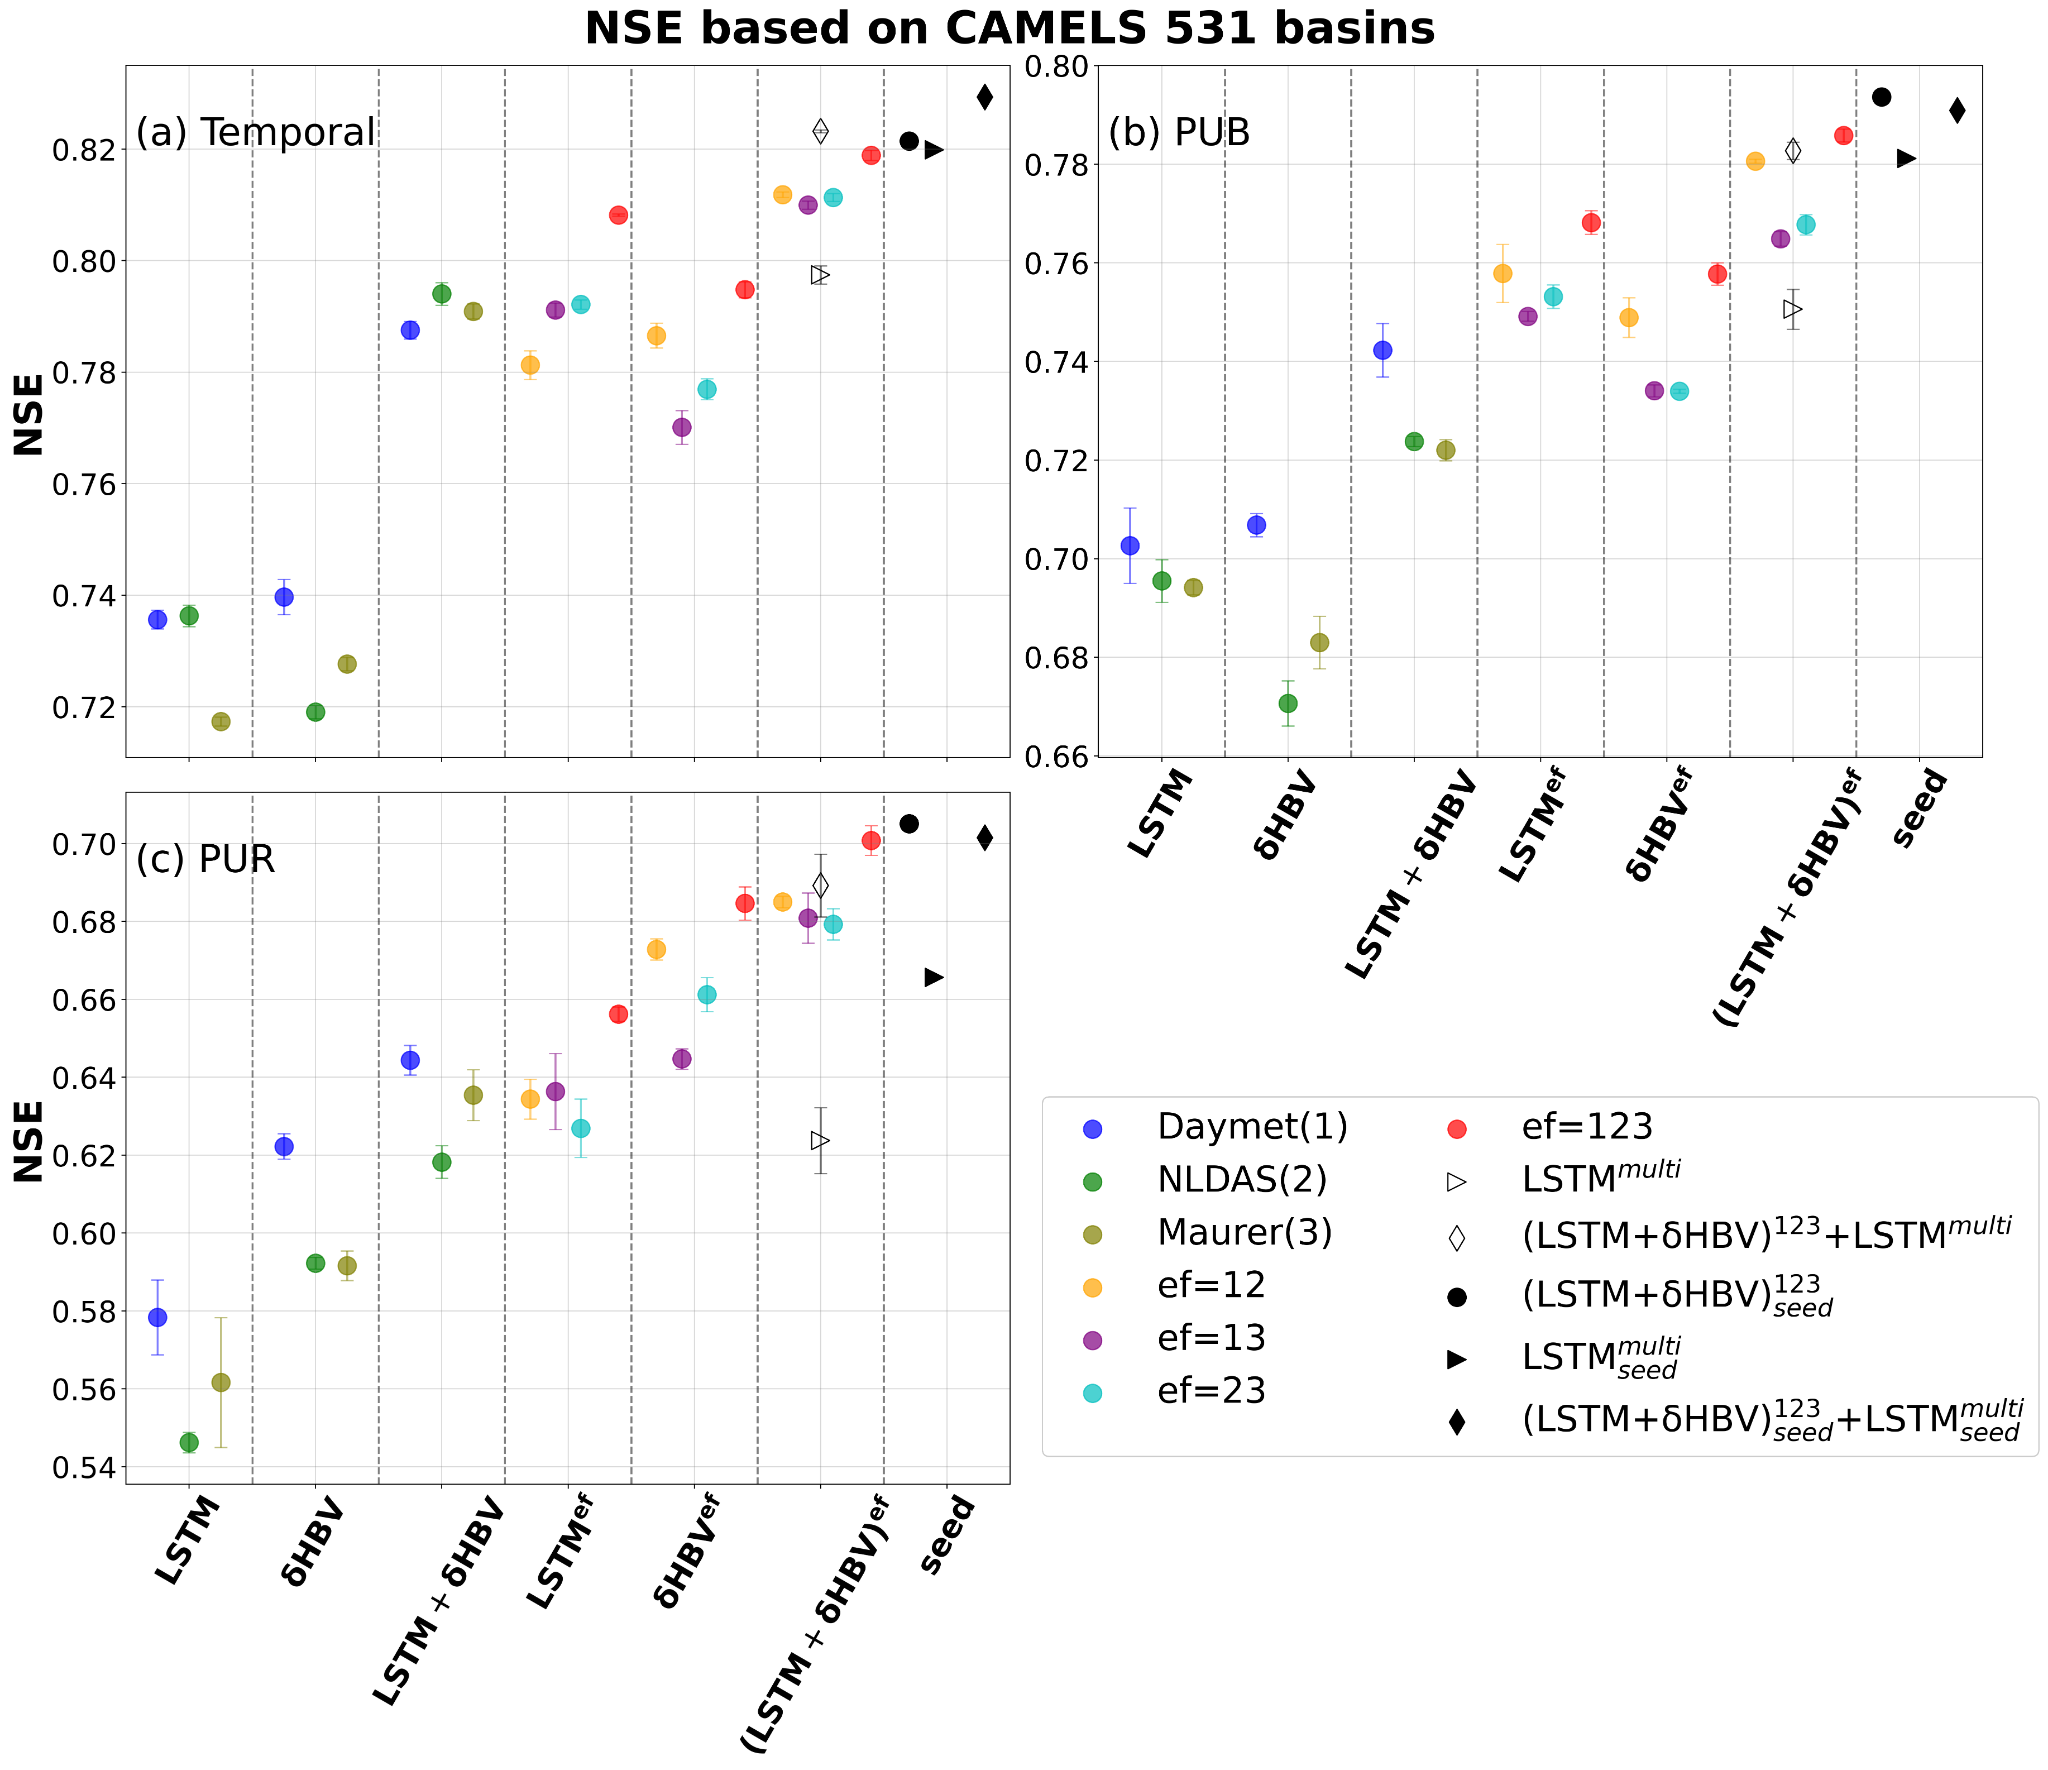
Median NSE values over the selected 531 CAMELS basins for temporal, PUB, and PUR tests. Different points represent LSTM, δHBV, their cross-model ensembles, and ensembles across forcing datasets. “LSTMmulti” denotes one LSTM trained with all three forcings as inputs, while “seed” denotes averaging across random seeds.
The corresponding streamflow simulations are publicly available from Zenodo.